Swiss Viz Awards
Celebrating Excellence in Data Visualization in Switzerland.
September 14, 2026
We start accepting entries for this year's award.
October 16, 2026
Last day to submit your work for consideration.
December 10, 2026
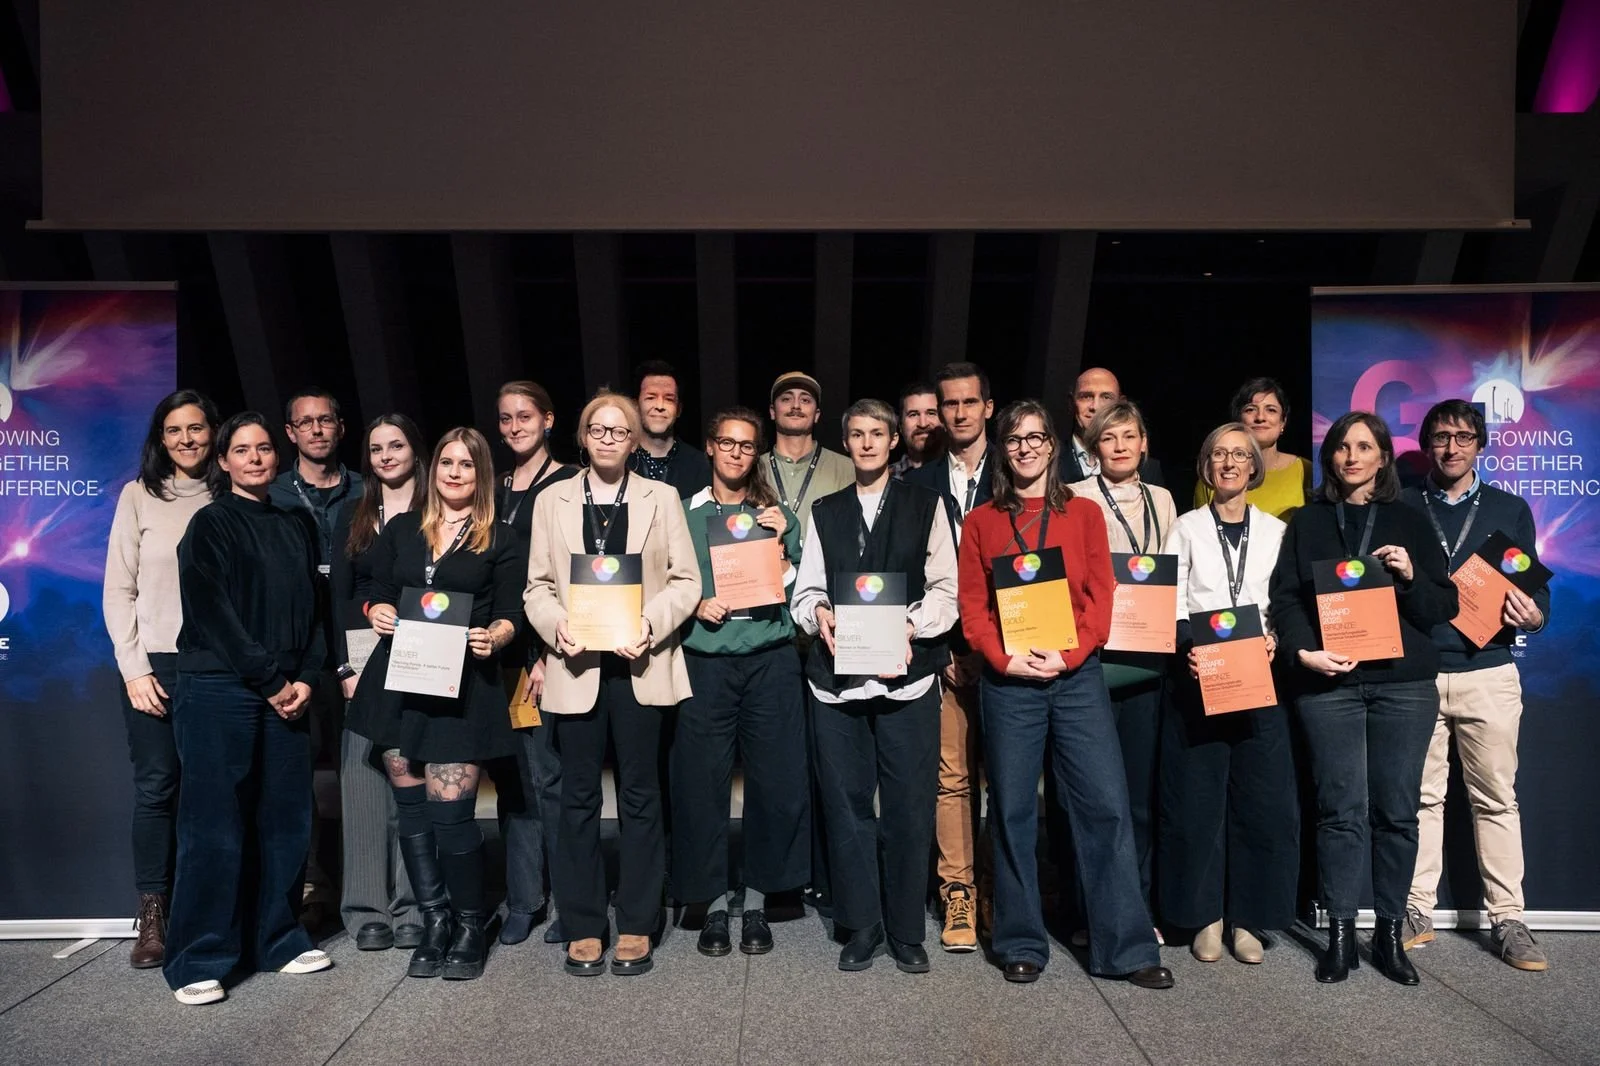
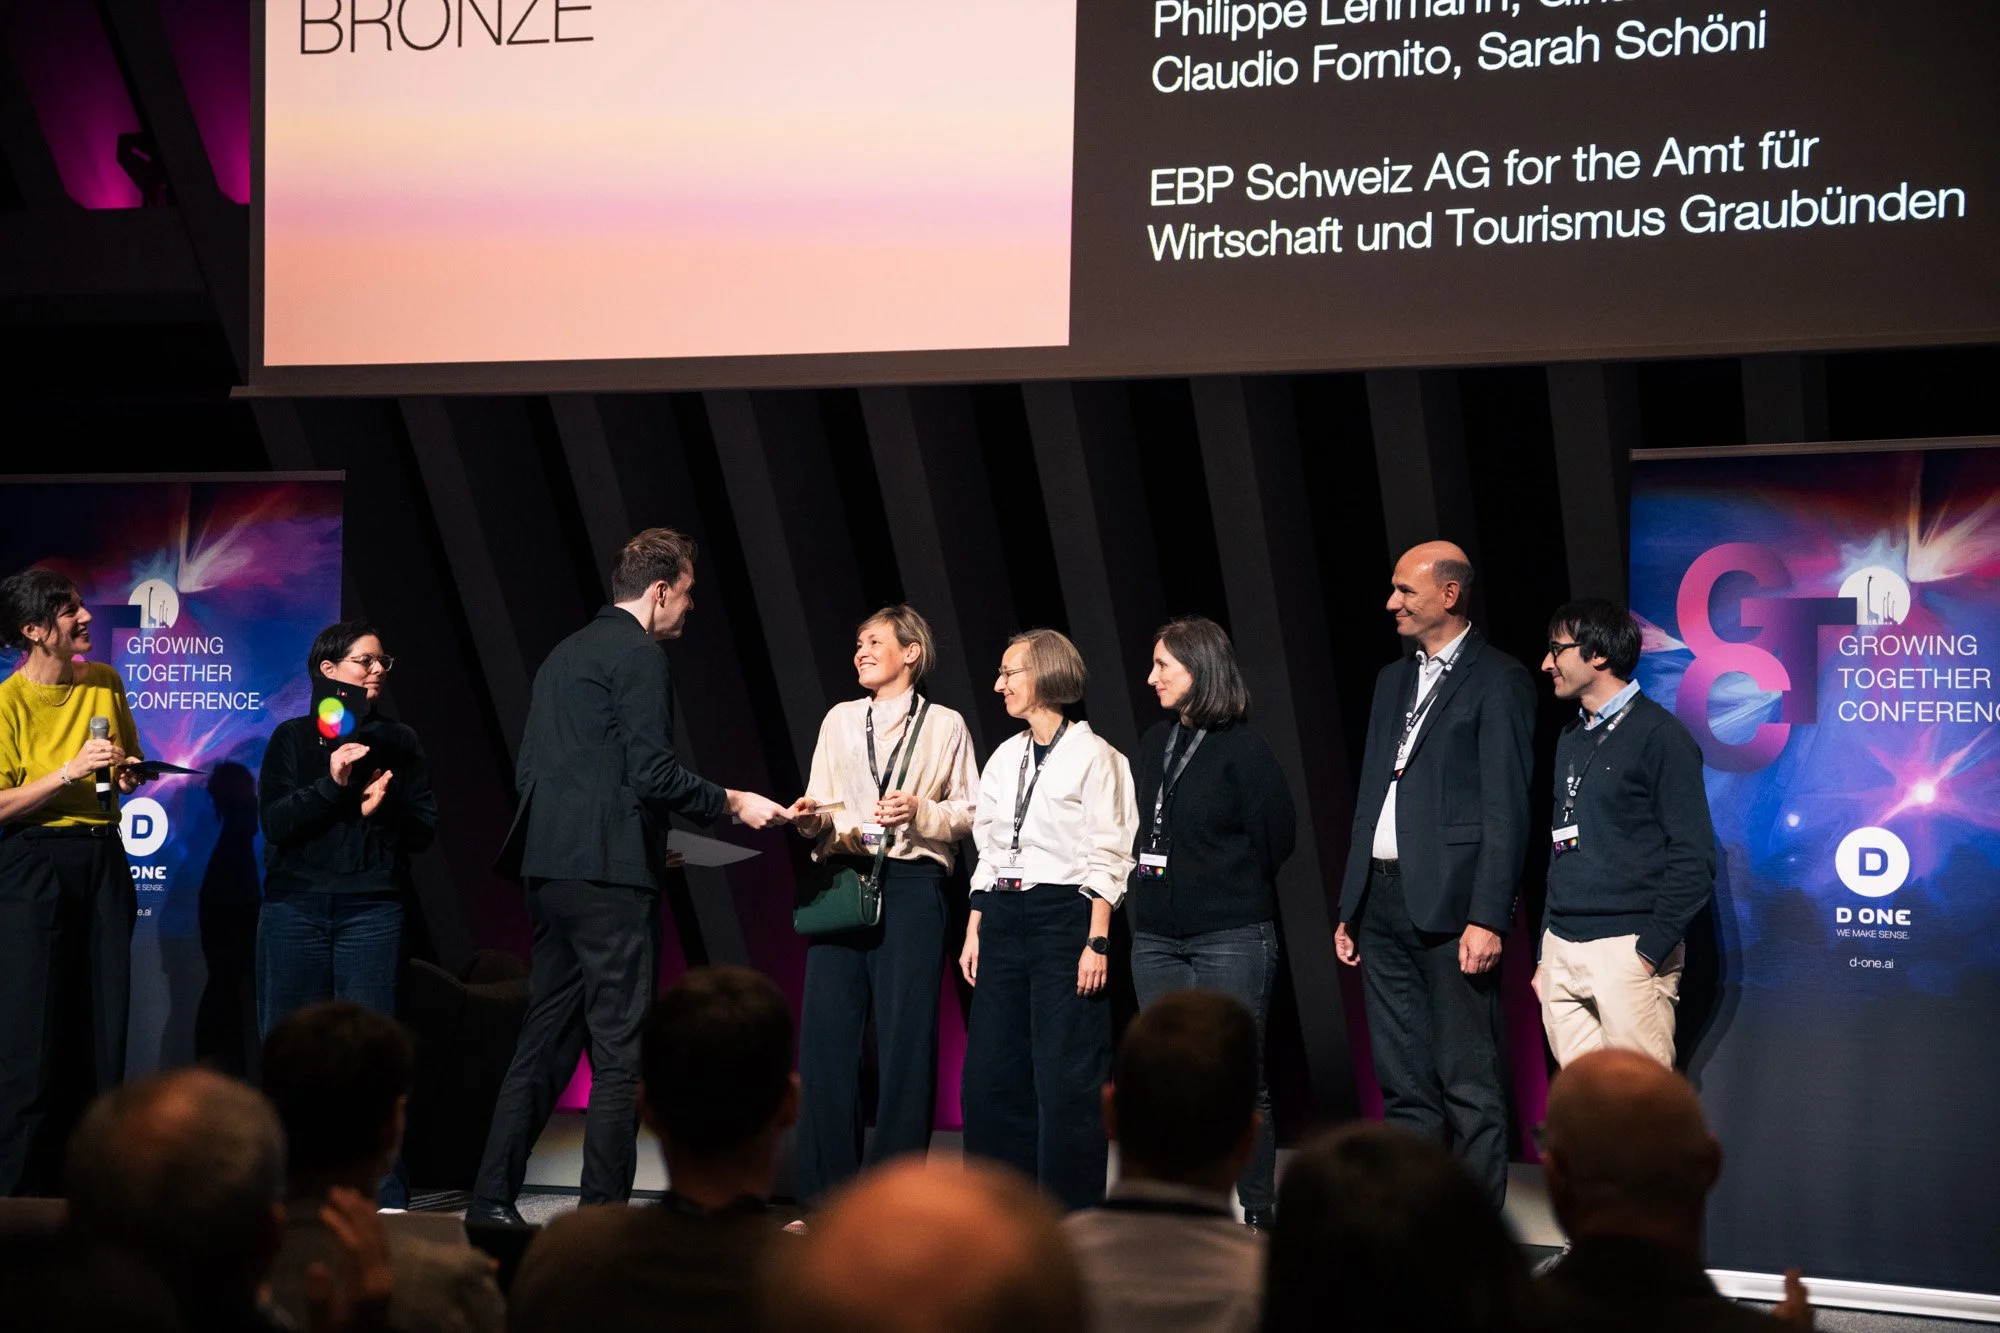
We announce the winners at the award ceremony.
About the Awards
Visualization plays a pivotal role in the data journey. It imparts knowledge and understanding, influences perception, guides decisions, and sparks inspiration.
In collaboration with the Data Innovation Alliance, the Swiss Viz Awards bring together people who are passionate about how data is represented and experienced. These awards not only recognize exceptional works and creators each year, they also help promote the discipline to a broader audience.
Strengthening the discipline of data visualization is essential on two fronts:
Strengthen Community
Fostering a diverse and vibrant community, including industry professionals, renowned experts, and students.
Raise Awareness
Raising public awareness of the value of data visualization across a wide range of fields.
Award Categories
We accept submissions created in or related to Switzerland and published in 2025 or 2026. You can submit your work in one of the following categories.
Public Lens
Visualizations designed for broad public engagement. These works are accessible, compelling, and created to inform or inspire a general audience. They address societal, cultural, or global themes, and are often found in journalism, advocacy, or science communication.
Operational Insight
Visualizations created within institutions, companies, or governments to support monitoring, reporting, or decision-making. These can take the form of dashboards, strategic visuals, or data applications, and are typically tailored to a specific internal use case.
Avant-Garde
Experimental, unconventional, or artistic visualizations that push the boundaries of form, technique, or concept. These works may explore new mediums, blend disciplines, or challenge what data visualization can be, from aesthetics to interactivity.
Student Work
Visualizations created by students and emerging practitioners in academic contexts. Curious and exploratory, they bring fresh perspectives, test new approaches, and reflect the next generation of data visualization.
Submission Guidelines
When to Submit
• September 14, 2026: Submissions open
• October 16, 2026: Submissions close
• December 10, 2026: Award ceremony
Who Can Submit
We welcome submissions from anyone:
• Individuals or teams
• Professionals, students, or amateurs
• Companies, agencies, or freelancers
• Newsrooms, universities, or institutes
What You Can Submit
We accept submissions in any format:
• Static, interactive, or animated
• Digital, printed, or physical
• Online or offline
What to Include
We need this about your submission:
• Title of the visualization
• Image or video of the visualization
• Link to the visualization
• Selected award category
• Description of purpose and goals
• Description of target audience
• Description of intended impact
• Date of publication
• Names of authors
• Optional: Mark as «Confidential»
Submission Costs
The Swiss Viz Awards are not for profit and participating is completely free of charge.
Confidential Entries
Participants are responsible for providing access to their work (e.g. links or files) so that our jury can view and evaluate it in its intended form. All submissions are kept confidential and shared only with the jury. If selected for recognition, we will collaborate with you to anonymize sensitive data before any public sharing.
Student Entries
We strongly encourage students to participate! Please select the separate award category «Student Work» in the submission form.
What You'll Win
Winners in each category will receive an official Swiss Viz Award and be featured across Data Innovation Alliance communication channels including website, social media, and publications.
Ready to submit your best work?
Jury Members
Our jury includes experts from academia, government, journalism, and design.

Antonella Autuori
PhD Student, SUPSI Institute of Design and Lecturer, MA in Interaction Design
Antonella works at the intersection of information design and critical approaches to data and AI. Her research, conducted between SUPSI and RMIT University, explores how data practices within AI can be opened to participation and situated forms of knowledge. She is committed to data visualisation as a critical and situated practice that makes complexity accessible while also revealing the choices and perspectives that shape how data is produced and represented.

Sebastian Baumhauer
Principal Consultant, D ONE
Sebastian helps organizations build modern data analytics and AI ecosystems. He focuses on empowering business functions to do more with data, promoting decentralization concepts such as self-service analytics, while integrating AI capabilities. Advising on and teaching efficient data visualization is not just a core component of his work, but also his passion. He stands for no-frills, concise data visualization that communicates insights clearly and efficiently in business contexts.

Marina Bräm
Founder and CEO viz. bybraem, and Lecturer
Marina has been running her own studio, viz. bybraem, since 2020. Together with clients and experts, she develops data- and fact-based information and design concepts - both analog and digital. The aim is to convey complex content in an understandable and high-quality way. She previously worked as Digital Design Director and Head of Infographics at Tamedia AG. From 2013 to 2015, she built up the area of large infographics at NZZ am Sonntag. As a lecturer, she teaches at various universities, including ETH Zurich, HSLU and ZHDK.

Sebastian Broschinski
Interaction Designer, Tamedia
Sebastian is an experienced information designer at Tamedia, specializing in cartographic and interactive visual storytelling. He previously led the infographic department and served as deputy art director at Finanz und Wirtschaft. His award-winning work (Swiss Viz Award, Swiss Press Award) brings together design precision and journalistic depth. He studied at Hochschule Anhalt Dessau and ZHdK.

Prof. Dr. Martin Eppler
Communications & Knowledge Visualization, University of St. Gallen
Martin is a professor of communications management at the University of St. Gallen and director of the MCM Institute. His teaching and research focus on knowledge visualization, visual literacy, and data fluency. He has published more than 20 books and over 250 scientific articles, including “How to Talk About Data” (Financial Times Press). His work emphasizes the power of clear and insightful visual communication in professional contexts.

Nicole Lachenmeier
Co-Founder and Design Lead, Superdot Studio
As Lead Designer, Nicole shapes visual strategies and design systems that transform complex data into accessible knowledge. Her work bridges design, data, and communication – often beyond conventional chart forms. She is co-author of Visualizing Complexity and teaches information design at various universities. Through initiatives like On Data and Design, she promotes interdisciplinary exchange between design, research, and data practice.

Fabian Lang
Data Visualisation Specialist, Swiss Federal Statistical Office
Fabian Lang is a data visualization specialist at the Federal Statistical Office (FSO), where he transform complex statistics into clear, effective visualizations. Beyond his daily work, he authors data-driven books, using the craft of information design to tell engaging data stories. Independent of his role, his goal is always the same: to make information as accessible and meaningful to the public as possible.

Jan Wächter
Interaction and Data Visualization Designer, Interactive Things
Jan leads the design of data-driven applications and visualizations at Interactive Things. He combines data expertise with human-centered design to build tools and narratives that help users explore and understand complex information. His work spans various sectors and always puts usability and clarity at the forefront of innovation.

The jury is mentored by
Dr. Charlotte Cabane
Managing Consultant, D ONE
and Visiting Professor, University of Lucerne
Charlotte helps organizations harness their data to uncover insights and enable informed decision-making. She advocates for using data visualization as a powerful tool to spark meaningful conversations, foster alignment, and clearly communicate insights across diverse stakeholder groups. Charlotte promotes accessible, purpose-driven visualizations that support people in both their work and daily lives. She has been leading the Swiss Viz Award since 2023.

The jury is mentored by
Christian Erni
Head of Data Experience and Management Board Member, D ONE
Christian is a pioneer of new media communication and has a vast experience at the intersection of information and design. Before joining D ONE, he was Creative Director at international agencies and lecturer for visual design at ZHdK. Christian presides 16 years the Best of Swiss Web (Creation Jury) and was juror at the New York Festivals and Eurobest. Christian is the D ONE communication director and is heading its data experience practice.
Award Ceremony